
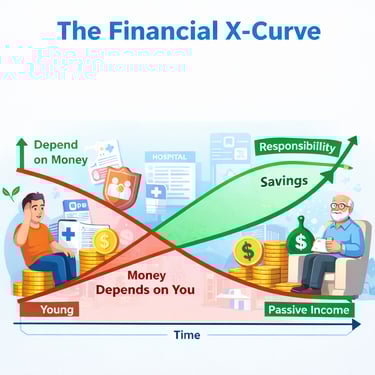
1️⃣ What is the Financial X-Curve?
It shows how your life money system flips over time.
There are two curves:
Curve What it means
🔴 Red Curve – Money Depends on You How much your lifestyle relies on you working
🟢 Green Curve – Money Works for You How much your money can pay your bills without you working
They cross — that crossing point is the X.
2️⃣ Early Life — You Work or You Starve 😅
At the start:
You are young.
You have little or no savings.
Every dollar comes from your job.
Reality:
If you don’t show up to work → rent, food, bills all stop.
So the chart looks like this:
Age Who depends on whom?
20–30💯 Money depends on YOU
Savings Almost nothing
Stress High
This is the danger zone.
3️⃣ Middle Life — The Crossing Point ⚖️
Now you start doing something smart:
Save money.
Invest money.
Buy assets that pay you (stocks, rentals, businesses, retirement plans).
Gradually:
Your investments grow.
Your salary matters less.
Your money starts helping you.
This is where the two lines meet — the X-Point.
Age Situation
35–50 Your savings start paying part of your life
Example Rent paid partly by investments
Stress Decreasing
4️⃣ Later Life — Money Works While You Rest 😎
Now the green curve is higher than the red one.
Your money pays your bills.
You work because you want to, not because you must.
Age Situation
55+ Passive income > Expenses
Example Dividends, interest, rent cover your lifestyle
Freedom Maximum
This is real financial freedom.
5️⃣ Why Most People Fail
Most people stay stuck on the red curve because:
They only spend.
They don’t invest.
They upgrade lifestyle faster than savings.
So when they stop working → money stops too.
6️⃣ The One-Line Rule
If your money depends on you, you are trapped.
If you depend on your money, you are free.
That flip — from working for money to having money work for you — is the Financial X-Curve.

Contact
Let's plan your financial future together.
Phone
asinha@aspirewealthfinancials.com
281-810-9027
© 2025. All rights reserved.